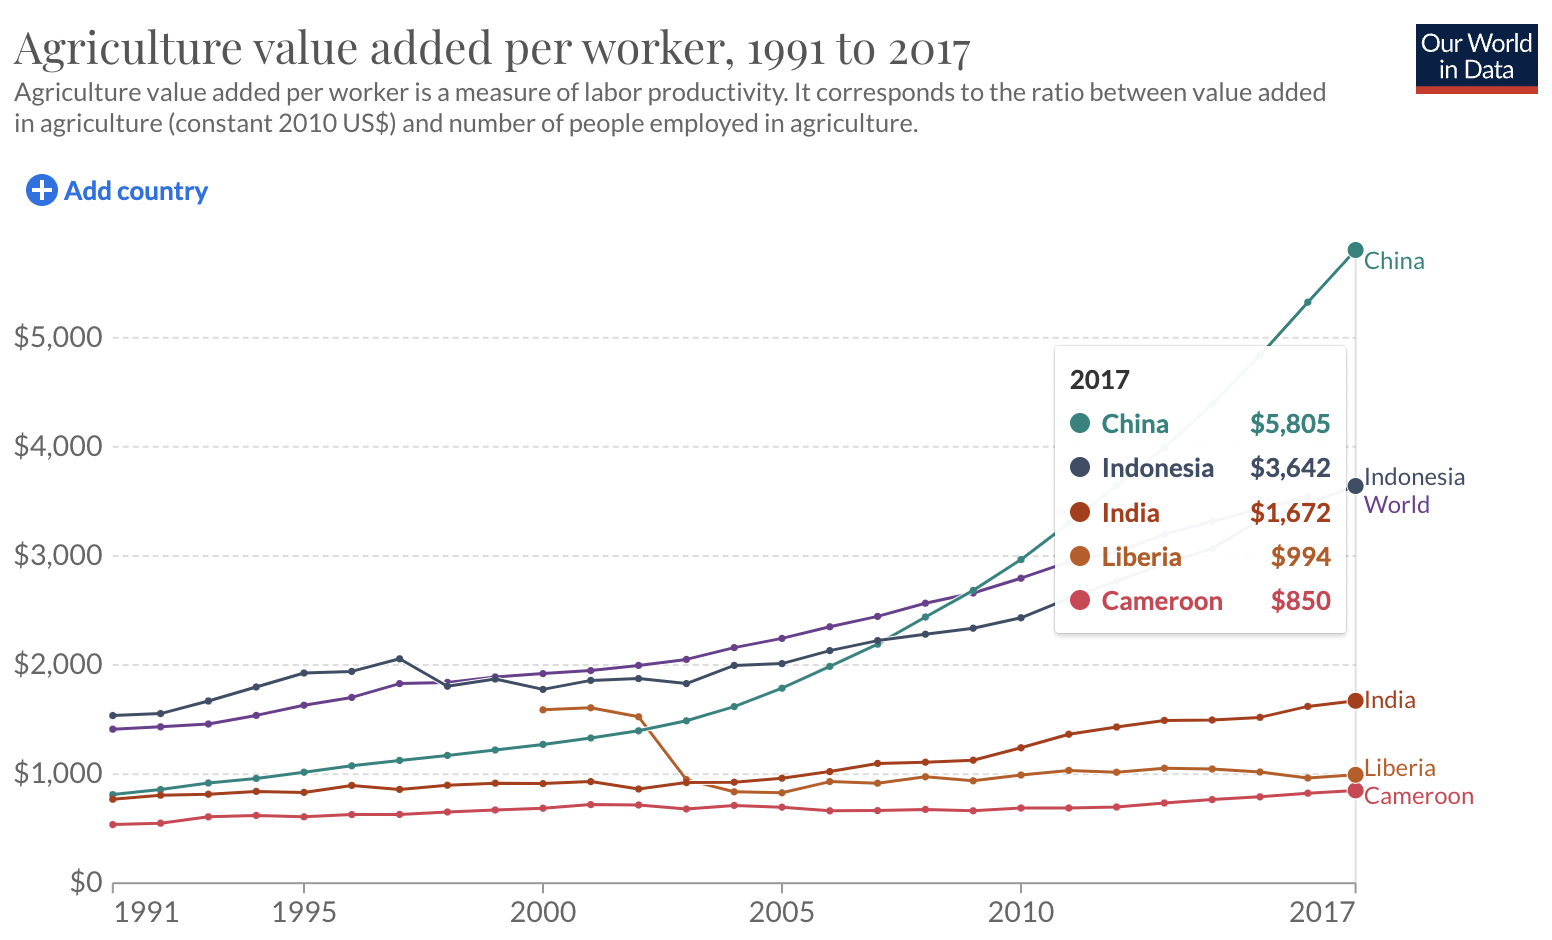
I downloaded agriculture value added per worker data from Our World in Data. I selected this data because I am interested in the labor productivity of agricultural workers from 1991 to 2017.
This is the link to the data.
The following code chunk loads the package I will use to read in and prepare the data for analysis.
- Read the data in
- Use glimpse to see the names and types of the columns.
glimpse(agrictulture_value_added_per_worker_wdi)
Rows: 5,233
Columns: 4
$ Entity                                                    <chr> "A…
$ Code                                                      <chr> "A…
$ Year                                                      <dbl> 20…
$ `Agriculture, value added per worker (constant 2010 US$)` <dbl> 87…
# View(agrictulture_value_added_per_worker_wdi)
- Use output from glimpse (and View) to prepare the data for analysis.
Create the object ‘regions’ that is a list of regions I want to extract from the dataset
Change the name of the 1st column to Region and the 4th column to Value Added per Worker
Use filter to extract the rows that I want to keep: Year >= 2000 and Region in regions
Select the columns to keep: Region, Year, Valueaddedperworker
Use mutate to convert Valueaddedperworker to dollars
Assign the output to regional_value
Display the first 10 rows of regional_value
regions <- c("China",
             "Indonesia",
             "India",
             "Liberia",
             "Cameroon",
             "world")

regional_value <- agrictulture_value_added_per_worker_wdi %>%
  rename(Region = 1, Valueaddedperworker = 4) %>%
  filter(Year >= 2000, Region %in% regions) %>%
  select(Region, Year, Valueaddedperworker) %>%
  mutate(Valueaddedperworker = Valueaddedperworker * 1e+0)

regional_value
# A tibble: 90 × 3
   Region    Year Valueaddedperworker
   <chr>    <dbl>               <dbl>
 1 Cameroon  2000                688.
 2 Cameroon  2001                720.
 3 Cameroon  2002                718.
 4 Cameroon  2003                681.
 5 Cameroon  2004                714.
 6 Cameroon  2005                696.
 7 Cameroon  2006                664.
 8 Cameroon  2007                666.
 9 Cameroon  2008                676.
10 Cameroon  2009                663.
# … with 80 more rows
Check that the total for 2017 equals the total in the graph
# A tibble: 1 × 1
  total_value
        <dbl>
1      12963.
Add a picture
See how to change the width in the R Markdown Cookbook
Write the data to file in the project directory
write_csv(regional_value, file ="regional_value.csv")